
Agents, MCP, and Kubernetes, Part 4
Learn how to observe and operate AI agent platforms on Kubernetes using Istio Ambient Mode, Kiali, AgentGateway, and Prometheus, with practical guidance on performance, reliability, and governance.
- Prashant Ramhit & Yevhen Khvastunov
- 6 min read

Introduction
In the first three parts of this series, we built out the core capabilities of an agent platform on Kubernetes.
Part 1 covered deploying agents and MCP servers. Part 2 brought in zero-trust connectivity with Istio Ambient Mode. Part 3 added application-level governance through AgentGateway.
At this point, the platform can handle real workloads within defined security and policy boundaries. Now we need operational visibility.
Once agents start running production workflows, we need to understand how requests flow through the system, where latency creeps in, how failures propagate, and whether enforcement policies are actually working. Without this visibility, diagnosing incidents and maintaining performance gets complicated fast.
This post walks through how we use Kiali, AgentGateway’s management interface, Prometheus, and Istio telemetry together to monitor service behavior, resource usage, and overall system health.
What Needs to Be Observed
When we’re running agent platforms at scale, certain questions come up repeatedly: which services are talking to each other and how much, where latency is building up, which requests are failing and why, whether governance policies are actually being enforced, how much external API usage we’re generating, and which components are getting close to their limits.
These questions span infrastructure, network, and application layers. No single tool gives us all the answers.
Observability Architecture
We’ve built the observability stack around five core components:
- Istio Ambient Mode for transport telemetry
- Kiali for mesh visualization
- AgentGateway UI and metrics for application insight
- Prometheus for metric collection
- Grafana for dashboards
Each layer gives us a different view of the system. Together, they create a coherent operational model.
Kiali and Istio Ambient Mode
In our platform, Kiali is the primary visibility layer for Istio Ambient Mode.
Unlike sidecar-based meshes, Ambient Mode moves interception into shared ztunnel and waypoint proxies. This simplifies application deployment but centralizes where we observe traffic.
Kiali reconstructs service relationships using telemetry from these components.
Topology in Ambient Mode
The topology view shows logical service relationships rather than pod-level wiring. In a typical deployment, we see:
- Agent workloads communicating with AgentGateway through ztunnel
- Traffic passing through waypoint proxies when L7 policies apply
- AgentGateway forwarding requests to LLM providers and MCP servers
Because interception is centralized, the graph stays readable even as the cluster grows.
When we see unexpected paths, it usually means we’re missing AuthorizationPolicy rules, have misconfigured ServiceEntries, or incomplete waypoint coverage.
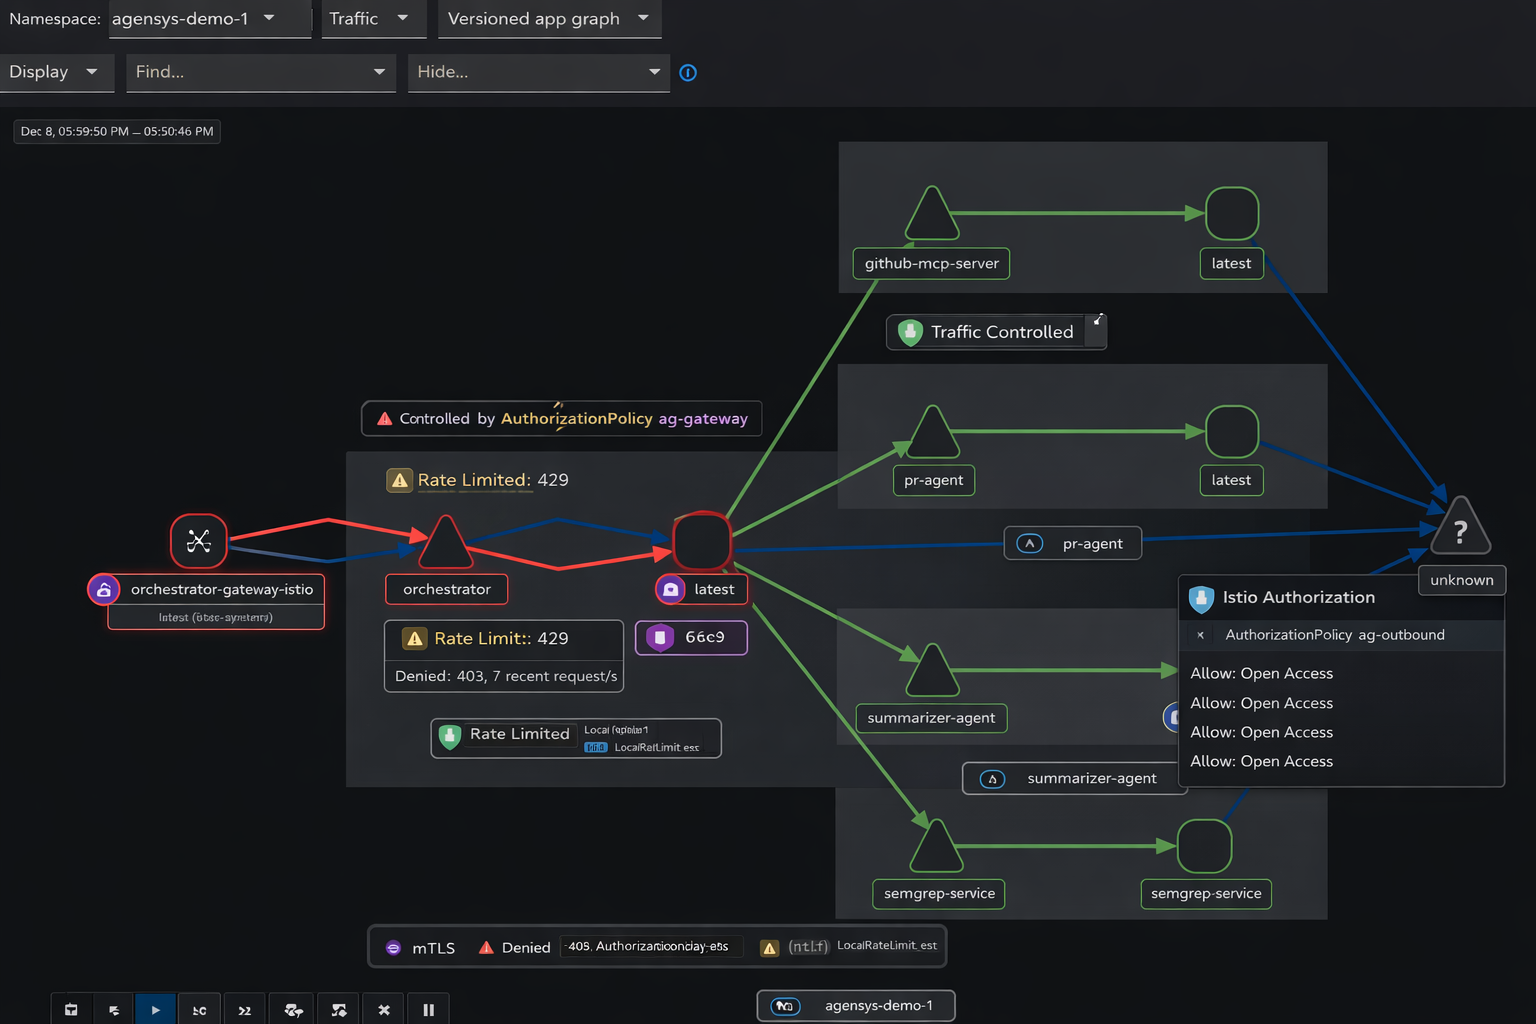
Authorization and Policy Visibility
Kiali overlays authorization results directly on service edges. In Ambient deployments, we can immediately see which connections are allowed or denied at L4, where L7 enforcement is active, and which routes are experiencing retries or failures. Policy violations show up right on the graph, so we spend less time digging through logs.
Latency Analysis
Latency heatmaps pull in timing data from ztunnel and waypoint proxies. This lets us tell the difference between gateway-induced delays, backend processing latency, and network-level congestion. For agent systems that rely on external models and tools, being able to make this distinction matters a lot.
Observing Behavior with the AgentGateway UI
AgentGateway has an administrative interface that complements Kiali’s network view.
While Kiali shows us how traffic moves through the mesh, the AgentGateway UI shows us how requests are handled at the application layer.
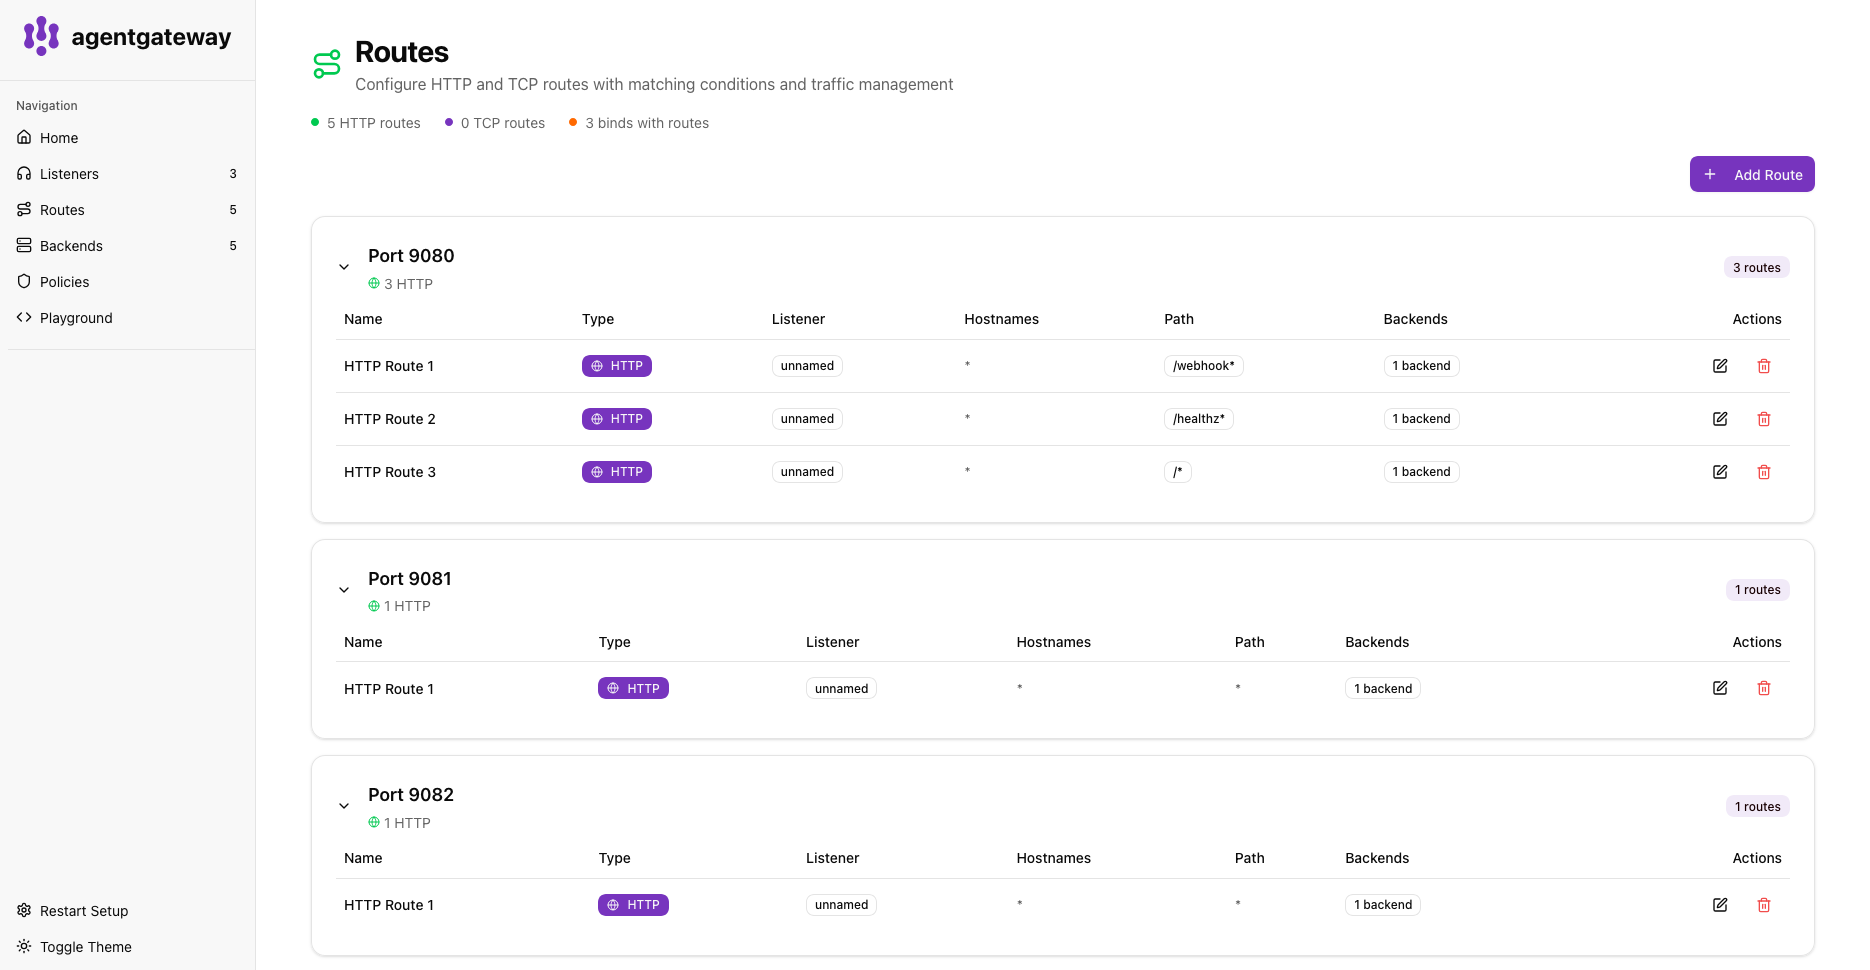
Request and Route Visibility
The UI gives us insight into active listeners and routes, request volume per endpoint, backend health, response codes, and routing decisions. This is often the fastest way to verify whether traffic is being processed as expected.
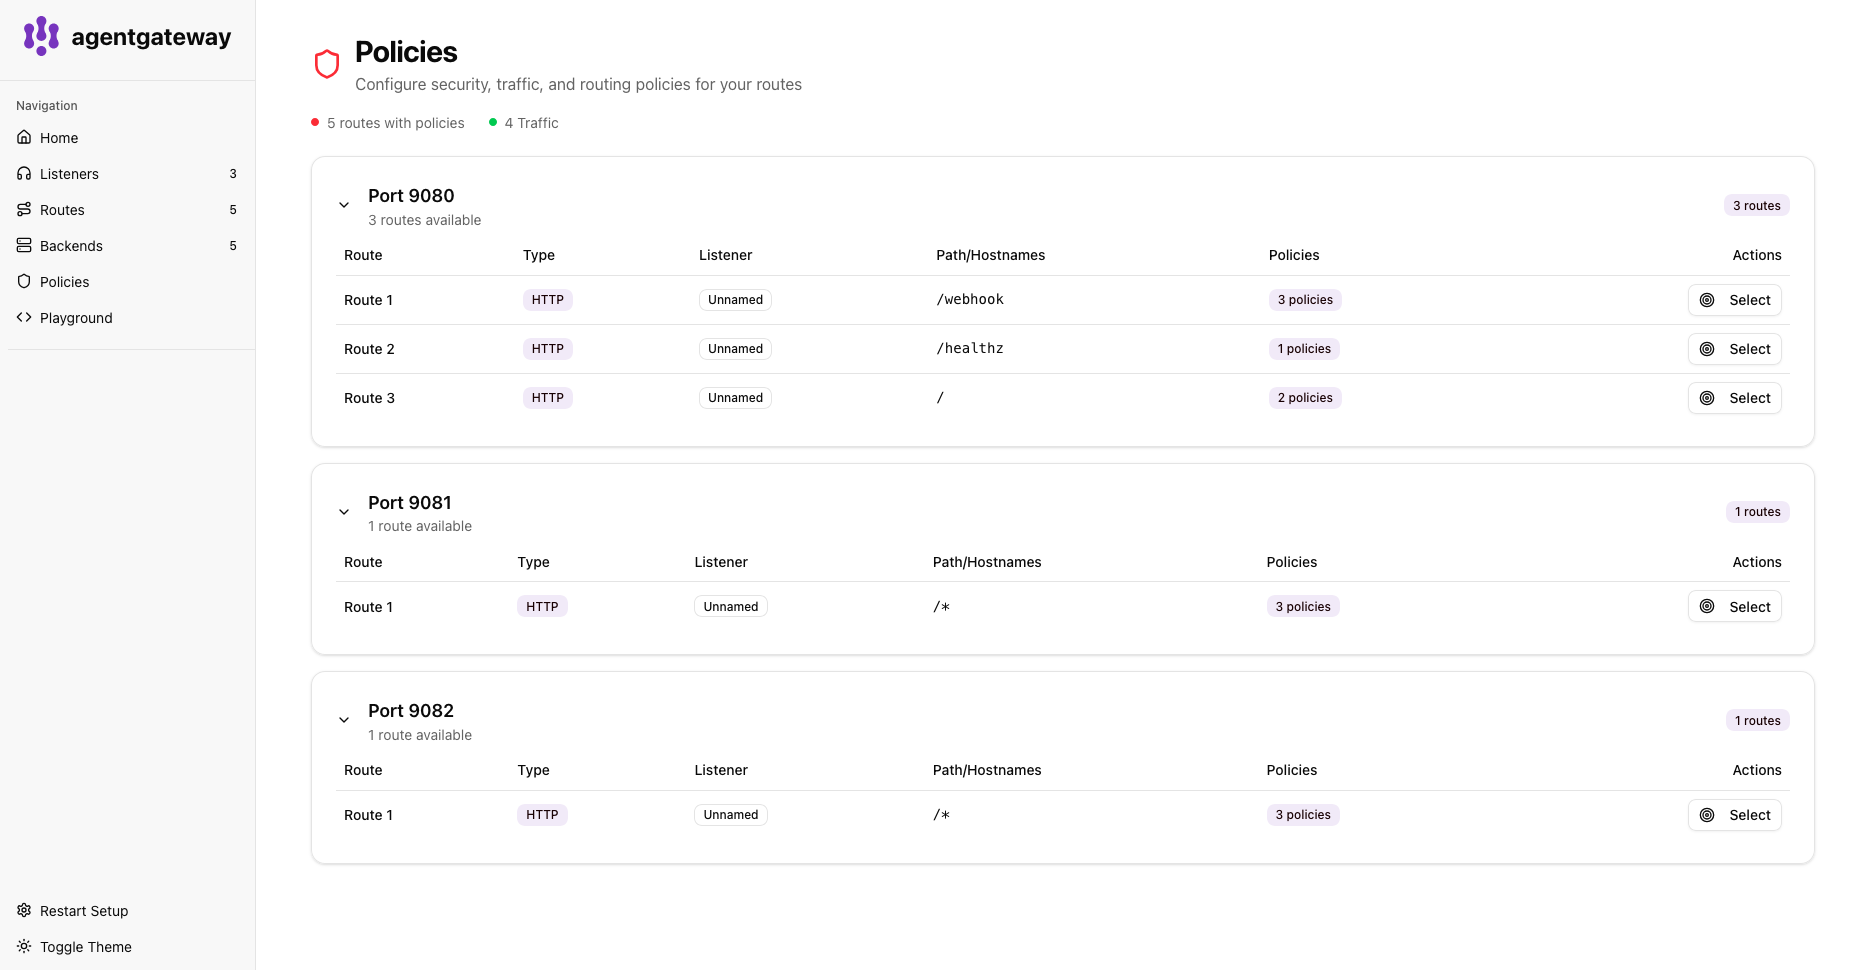
Policy and Security Feedback
AgentGateway enforces CEL-based authorization and filtering rules. The UI surfaces policy evaluation outcomes, rejected requests, secret filtering events, and header and payload validation failures. This makes it straightforward to confirm that governance rules are working correctly without having to parse logs.
Operational Debugging
During incidents, the UI comes in handy for identifying overloaded listeners, detecting misrouted traffic, verifying credential injection, and watching real-time request patterns. It gives you a control-plane view of application behavior.
Prometheus and Metric Collection
Prometheus pulls in telemetry from Istio, AgentGateway, and application workloads. At minimum, it should scrape Istio telemetry endpoints, AgentGateway /metrics, and application metrics endpoints. All critical services should show up as scrape targets. If they’re missing, we’ve usually got deployment or annotation issues.
Core Istio Metrics
Istio exports a standard set of transport-level metrics:
- istio_requests_total
- istio_request_duration_seconds_bucket
- istio_requests_failed_total
- istio_request_bytes
- istio_response_bytes
These metrics help us analyze traffic volume, reliability, and latency across services.
AgentGateway Metrics
AgentGateway publishes detailed application telemetry:
- agentgateway_requests_total
- agentgateway_request_duration_seconds_bucket
- agentgateway_rate_limited_total
- agentgateway_cel_policy_deny_total
These metrics show listener utilization, rate limit enforcement, policy rejections, backend failure rates, and route-level latency. They give us direct visibility into how governance is affecting real workloads.
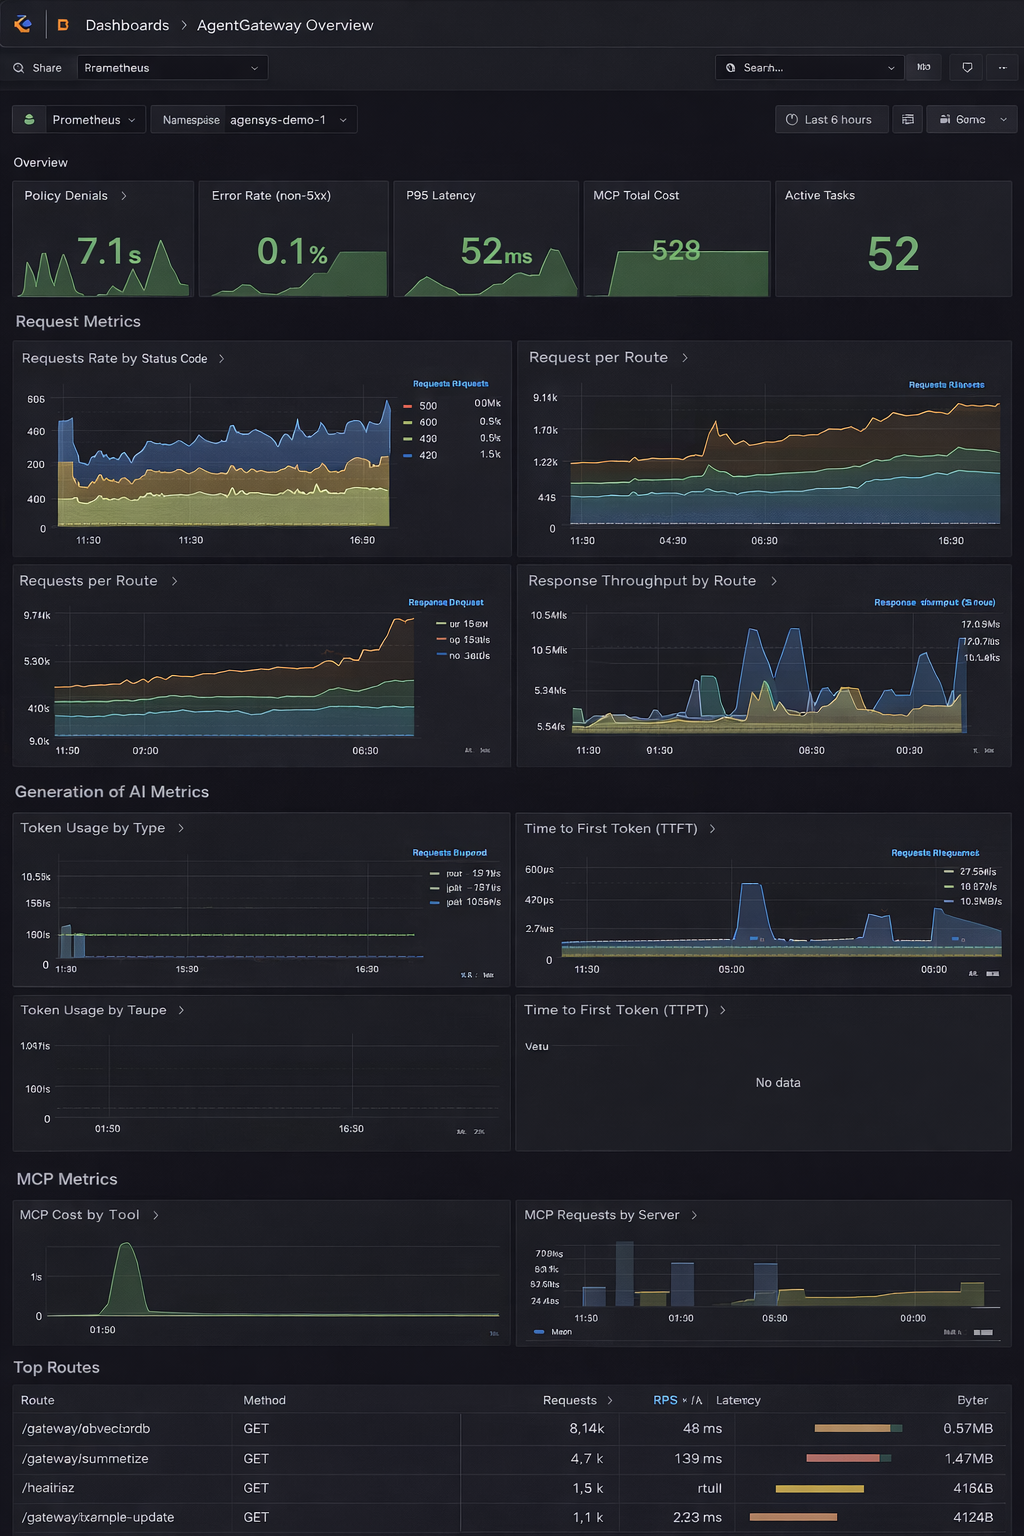
Building Operational Dashboards
Good dashboards combine network, application, and infrastructure views.
Here’s a practical layout with the template availble from Grafana Agentgateway Overview
Traffic and Reliability
- Requests per second
- Success and failure ratios
- Retry volume
Performance
- P95 and P99 latency
- Gateway-to-backend timing
- Queue depth
Governance
- Policy denials
- Secret filtering events
- Authorization failures
Capacity
- CPU and memory for AgentGateway
- Node utilization
- Network throughput
When we can see these signals together, correlations become obvious.
Example: Diagnosing a Latency Increase
Here’s how a typical investigation plays out.
Kiali shows rising latency between agents and AgentGateway. At the same time, error ratios are climbing on that path.
The AgentGateway UI confirms that requests are being throttled upstream.
From there, we verify upstream limits and adjust backoff policies.
Prometheus shows a growing number of rate-limited requests on the LLM proxy listener.
This workflow helps us figure out whether the root cause is in external providers, gateway configuration, policy enforcement, or resource exhaustion.
Distributed Tracing: When we integrate with systems like Jaeger or Tempo, Istio propagates trace context across services. Tracing lets us inspect end-to-end workflows, identify slow spans, detect retry loops, and correlate failures with backend behavior. It’s especially valuable for intermittent issues.
Platform Health KPIs: In production, we track several categories of indicators continuously.
Reliability: Key reliability indicators include error rate per route, policy denials, and retry volume.
Performance: Critical performance metrics are P95/P99 latency, backend response time, and queue buildup.
Cost: Cost tracking focuses on token usage, provider request volume, and API call distribution.
Security:
- Security monitoring covers unexpected traffic paths, abnormal request patterns, and policy violations.
- Sustained changes in these KPIs often show up before visible incidents.
Conclusion
Observability makes the difference between an agent platform that we can actually operate and one that becomes a black box as complexity increases.
By combining Istio Ambient telemetry, Kiali visualization, AgentGateway UI and metrics, Prometheus aggregation, and Grafana dashboards, we get visibility into both infrastructure behavior and application intent.
This layered approach helps us respond to incidents faster, maintain predictable performance, and plan capacity with confidence.
With governance, security, and observability in place, we can run agent-based systems as stable production platforms instead of experimental pipelines.
References
- Kiali - https://kiali.io
- Istio Ambient Mode - https://istio.io/latest/docs/ambient/
- Prometheus - https://prometheus.io
- AgentGateway - https://github.com/agentgateway/agentgateway