
Observability for DRA Drivers
How Prometheus metrics landed in kubernetes-sigs/dra-example-driver's instrumentation, client-go REST metrics and Helm-ready scraping on port 8080.
- Vishal Anarase
- 6 min read
Dynamic Resource Allocation (DRA) is how Kubernetes schedules specialized hardware GPUs, NICs, FPGAs and other devices, without extending the legacy device plugin model. A DRA resource driver runs on each node, talks to the kubelet over gRPC, and prepares devices when a pod’s ResourceClaim is bound.
That is a lot of moving parts. When something goes wrong, a claim stuck in Prepared, a slow prepare path, or repeated API errors, you want metrics, not just logs.
Recently, metrics support merged into kubernetes-sigs/dra-example-driver, closing issue #134. This post walks through what shipped, why it matters for platform engineers, and how to scrape /metrics on a live cluster.
Why Metrics for a DRA Driver?
The example driver is the reference implementation many teams fork when building production drivers. Until this change, it had logging via klog, but no Prometheus surface—no counters for prepare failures, no latency histograms, no standard rest_client_* metrics for apiserver traffic.
For operators, that gap shows up as toil:
- Incident response: Is the driver failing prepares, or is the scheduler/API the problem?
- Capacity planning: How long do prepare operations take under load?
- Regression detection: Did a new release increase fatal background errors?
Metrics turn those questions into dashboards and alerts instead of log archaeology.
What Shipped
The merged pull request adds four layers of observability:
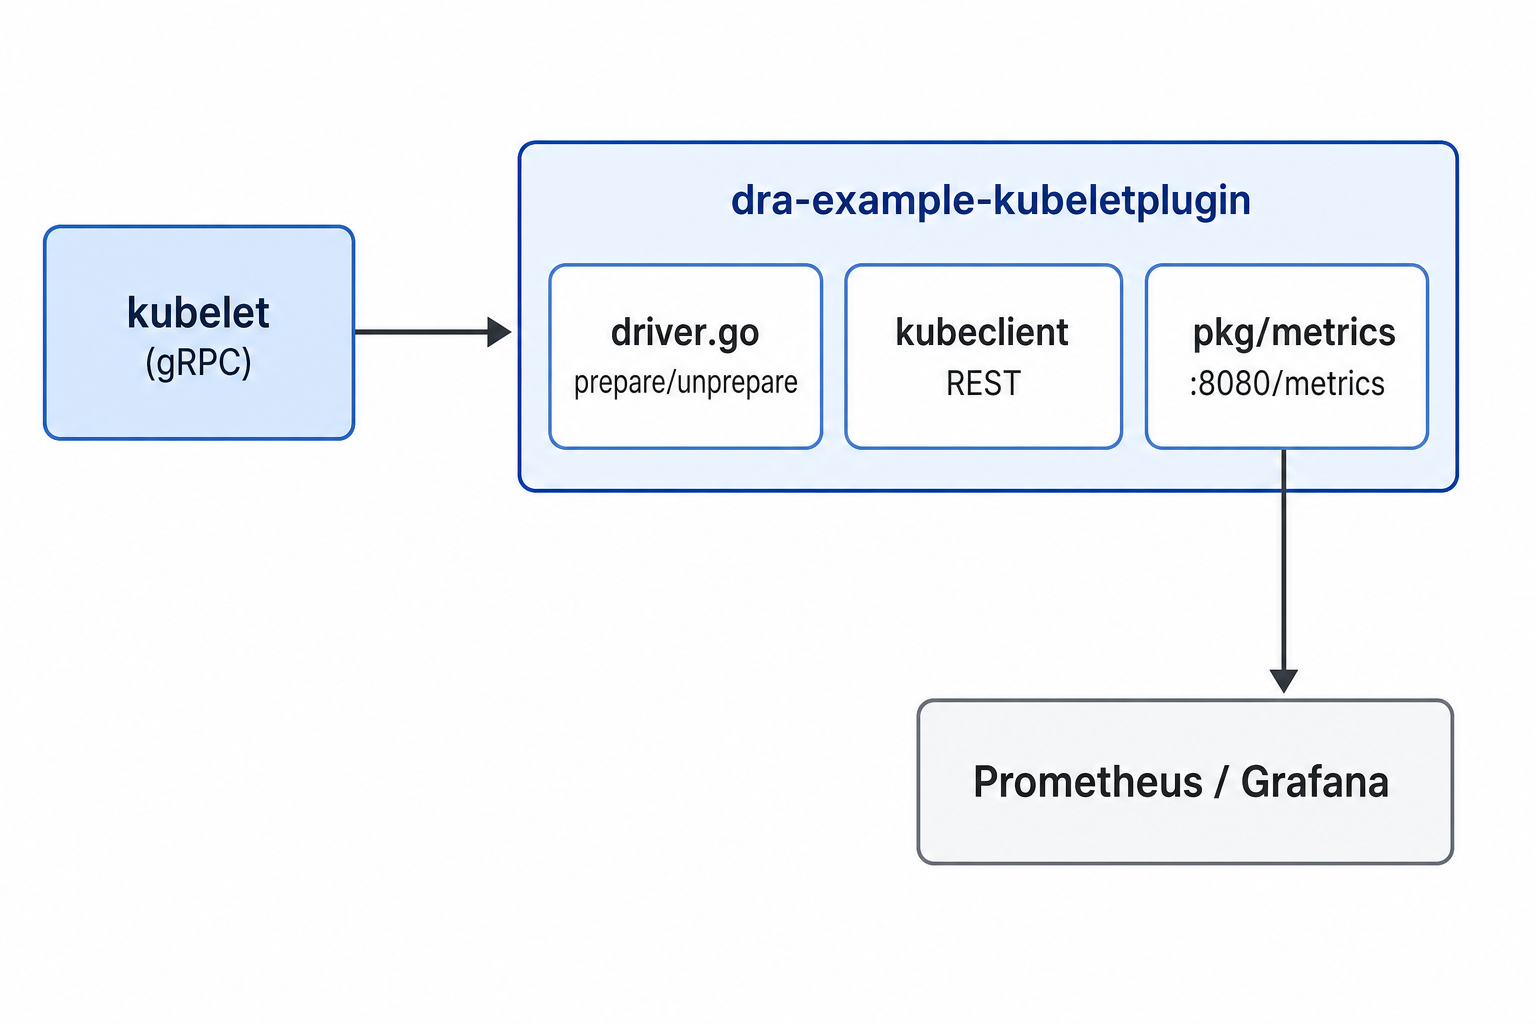
- pkg/metrics — Shared Prometheus plumbing using k8s.io/component-base/metrics/legacyregistry
- Driver instrumentation — Prepare/unprepare counters, latency histograms, and a fatal error counter
- Kubernetes API metrics — Standard client-go REST metrics via component-base/metrics/prometheus/restclient
- Helm chart — metricsPort: 8080, container port, env var, and a ClusterIP Service for scraping
Architecture
The kubelet facing gRPC server lives in upstream k8s.io/dynamic-resource-allocation/kubeletplugin. Instrumentation targets the driver callbacks in the example repo, where prepare and unprepare actually happen, rather than patching the upstream server.
Metrics Reference
Driver Operations
| Metric | Type | Labels |
|---|---|---|
| dra_example_driver_prepare_claims_total | Counter | result=success|error |
| dra_example_driver_prepare_claim_duration_seconds | Histogram | result |
| dra_example_driver_unprepare_claims_total | Counter | result |
| dra_example_driver_unprepare_claim_duration_seconds | Histogram | result |
| dra_example_driver_fatal_background_errors_total | Counter | — |
Prepare and unprepare counters are pre-initialized to zero so they appear on /metrics before the first workload. Histograms follow normal Prometheus behavior, they show up after the first observation.
Kubernetes API
A blank import of k8s.io/component-base/metrics/prometheus/restclient in pkg/flags/kubeclient.go wires standard client-go metrics, including:
- rest_client_requests_total
- rest_client_request_duration_seconds
- rest_client_request_retries_total
These appear once the driver makes API calls—for example publishing ResourceSlice objects or updating claim status.
Try It on a Cluster
Helm (metrics enabled by default)
After upgrading to a chart version that includes the merged work:
$ helm upgrade -i dra-example-driver deployments/helm/dra-example-driver \
  --namespace dra-example-driver --create-namespace --wait
Release "dra-example-driver" has been upgraded. Happy Helming!
NAME: dra-example-driver
LAST DEPLOYED: Thu Jun 25 17:46:55 2026
NAMESPACE: dra-example-driver
STATUS: deployed
REVISION: 2
TEST SUITE: None
Verify the history
❯ helm history dra-example-driver -n dra-example-driver
REVISION        UPDATED                         STATUS          CHART                           APP VERSION     DESCRIPTION
1               Wed Apr 22 17:34:42 2026        superseded      dra-example-driver-0.0.0-dev    v0.2.1          Install complete
2               Thu Jun 25 17:46:55 2026        deployed        dra-example-driver-0.0.0-dev    v0.3.0          Upgrade complete
Verify the metrics Service and scrape the endpoint:
$ kubectl get svc -n dra-example-driver | grep metrics
NAME                                       TYPE        CLUSTER-IP      EXTERNAL-IP   PORT(S)    AGE
dra-example-driver-kubeletplugin-metrics   ClusterIP   10.96.129.138   <none>        8080/TCP   18d
Port forward the svc to view locally
$ kubectl port-forward -n dra-example-driver \
  svc/dra-example-driver-kubeletplugin-metrics 8080:8080

Forwarding from 127.0.0.1:8080 -> 8080
Forwarding from [::1]:8080 -> 8080
Verify using curl request
$ curl -s localhost:8080/metrics | grep -E 'dra_example_driver|rest_client'
# HELP dra_example_driver_fatal_background_errors_total [BETA] Total number of fatal background errors reported by the driver.
# TYPE dra_example_driver_fatal_background_errors_total counter
dra_example_driver_fatal_background_errors_total 0
# HELP dra_example_driver_prepare_claims_total [BETA] Total number of resource claim prepare operations handled by the driver.
# TYPE dra_example_driver_prepare_claims_total counter
dra_example_driver_prepare_claims_total{result="error"} 0
dra_example_driver_prepare_claims_total{result="success"} 0
# HELP dra_example_driver_unprepare_claims_total [BETA] Total number of resource claim unprepare operations handled by the driver.
# TYPE dra_example_driver_unprepare_claims_total counter
dra_example_driver_unprepare_claims_total{result="error"} 0
dra_example_driver_unprepare_claims_total{result="success"} 0
To disable metrics in Helm, set kubeletPlugin.containers.plugin.metricsPort to a negative value.
Local Binary Development
Metrics are off by default when running the binary directly (--metrics-port defaults to -1). Enable explicitly:
./bin/dra-example-kubeletplugin \
  --node-name=test \
  --metrics-port=8080 \
  --kubeconfig="$HOME/.kube/config" \
  --kubelet-plugins-directory-path=/tmp/dra-plugin/plugins \
  --kubelet-registrar-directory-path=/tmp/dra-plugin/plugins_registry \
  --cdi-root=/tmp/dra-plugin/cdi
Non-zero prepare metrics require a real kubelet and a scheduled ResourceClaim. A local binary without kubelet sockets may only show rest_client_* or fatal_background_errors_total until the driver registers successfully.
Example PromQL
# Prepare error rate
rate(dra_example_driver_prepare_claims_total{result="error"}[5m])

# p99 prepare latency
histogram_quantile(0.99,
  sum(rate(dra_example_driver_prepare_claim_duration_seconds_bucket[5m])) by (le))

# Apiserver 5xx from the driver
sum(rate(rest_client_requests_total{code=~"5.."}[5m]))
Grafana Dashboard
Once Prometheus is scraping :8080/metrics, the PromQL above maps cleanly to dashboard panels. The screenshots below come from a starter DRA Example Driver dashboard on a kind-dra-example-driver-cluster local cluster, while cycling ResourceClaim workloads to generate prepare/unprepare activity.
Driver Operations
Stat panels give you an at-a-glance health check on the hot path. In this capture, 122 successful prepares matched 122 unprepares, with 0 prepare errors and 0 fatal background errors, useful as the first row you glance at during an incident.
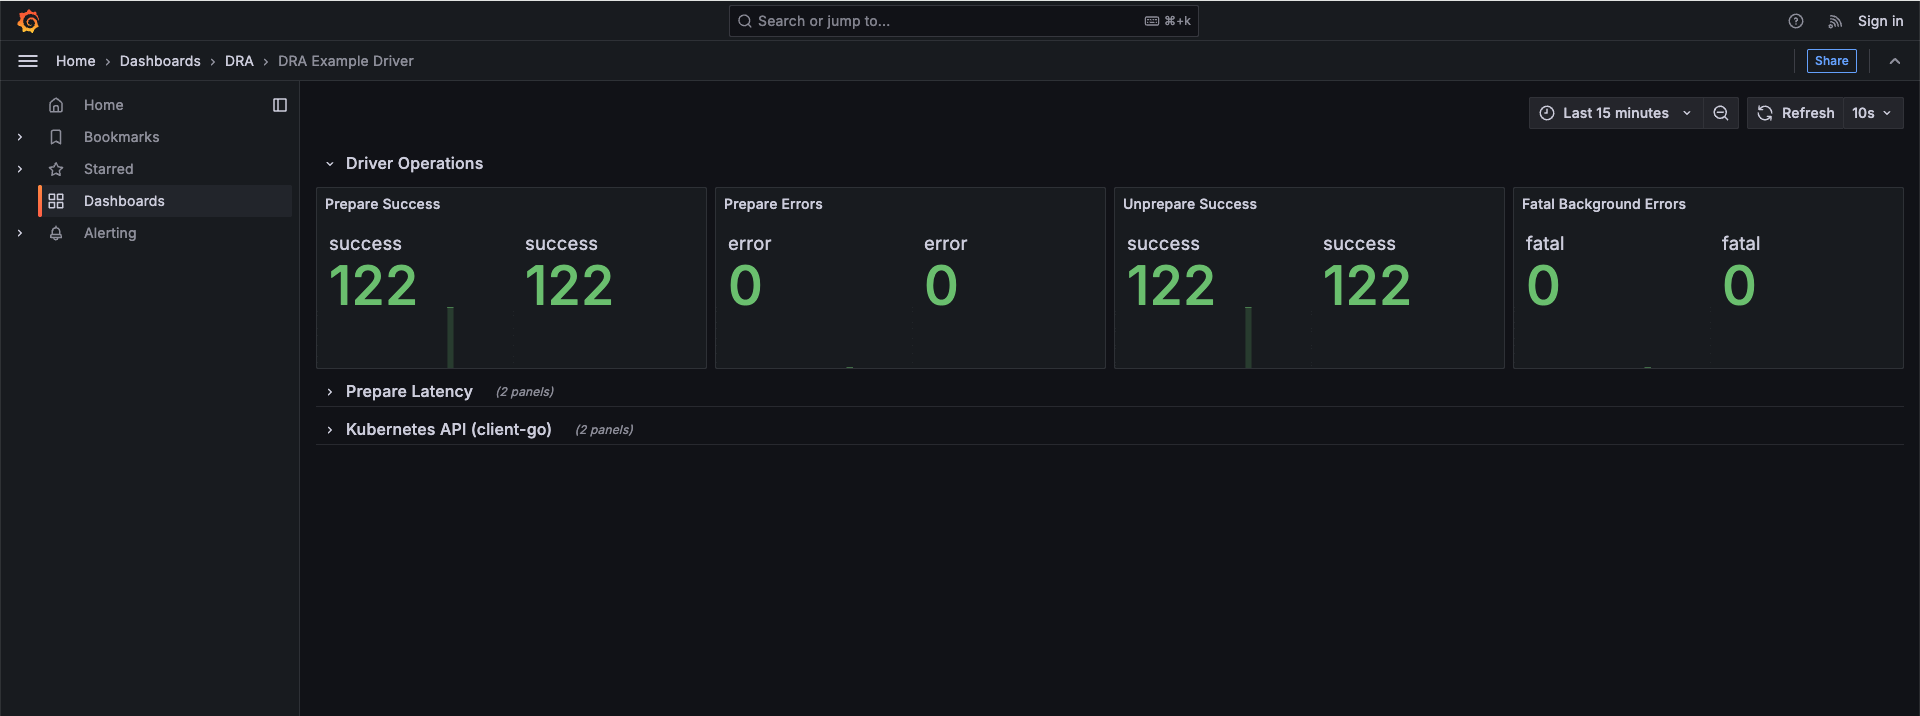
Key metrics: dra_example_driver_prepare_claims_total, dra_example_driver_unprepare_claims_total, and dra_example_driver_fatal_background_errors_total.
Prepare Latency
Histogram-backed panels show whether the driver is keeping up under load. During a burst of claim activity (~12:27–12:31), p50 prepare latency stayed near 2.7 ms while p99 peaked just under 5 ms. The rate panel tracks prepare and unprepare throughput together, helpful for correlating latency spikes with workload churn.
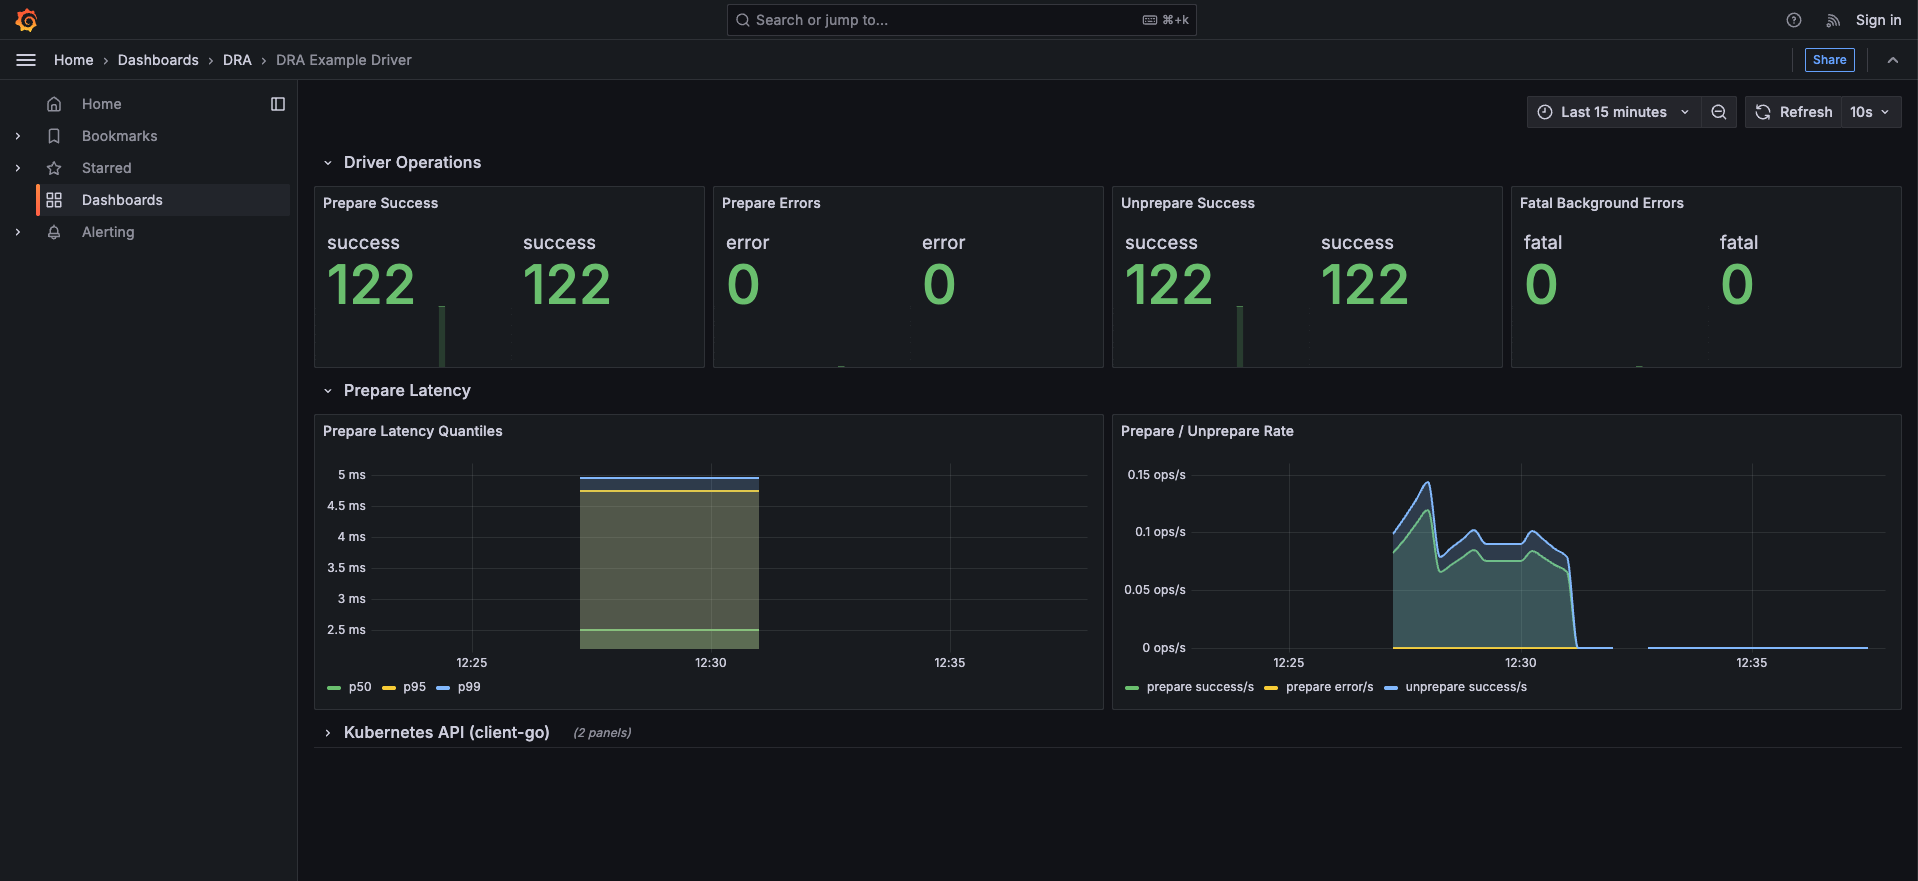
Key metrics: dra_example_driver_prepare_claim_duration_seconds (quantiles via histogram_quantile) and rate(dra_example_driver_*_claims_total[5m]).
Kubernetes API
When prepare counters look healthy but claims still misbehave, apiserver metrics help isolate control-plane issues. This row shows a GET 200 request burst peaking around 0.11 req/s during the same workload window, with p99 GET latency holding near 5 ms and no sustained error-rate elevation.
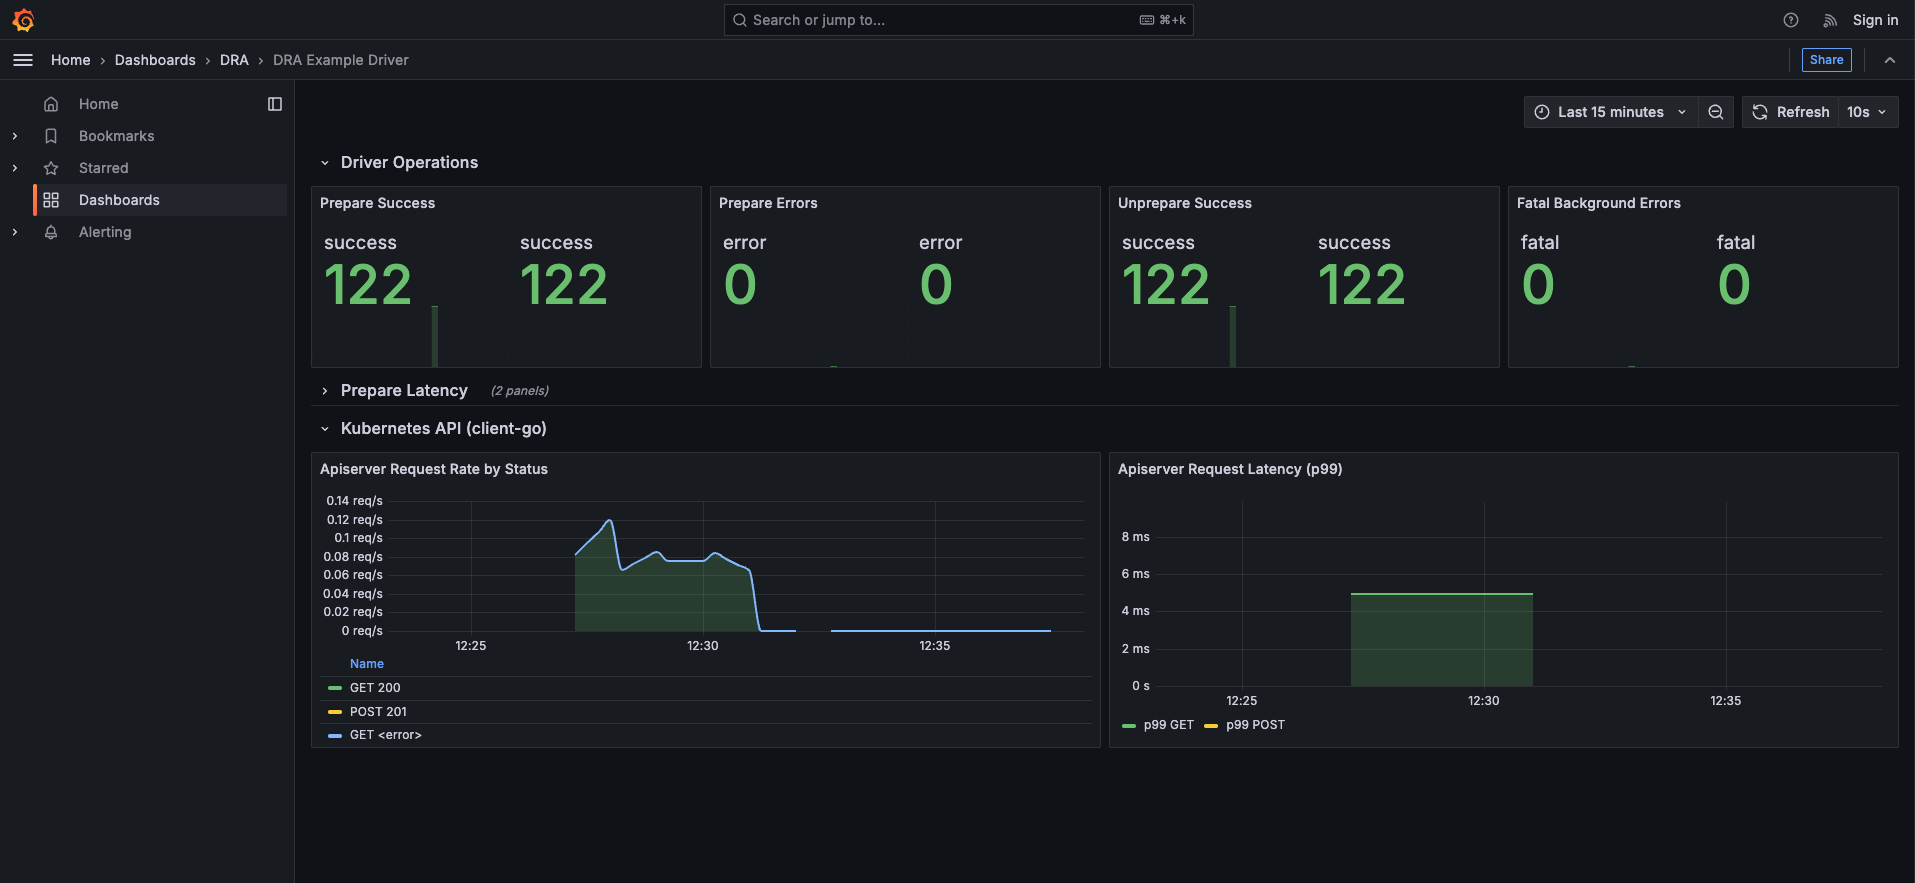
Key metrics: rest_client_requests_total and rest_client_request_duration_seconds.
Rate and latency graphs populate once Prometheus has a few scrape intervals of data, typically within a minute of pointing it at the metrics Service.
Patterns for Driver Authors
A few implementation choices worth reusing if you are building your own DRA driver:
Use the Kubernetes metrics stack:
k8s.io/component-base/metrics plus legacyregistry matches what core Kubernetes components use. The /metrics handler is legacyregistry.HandlerWithReset().
Instrument at the callback boundary:
PrepareResourceClaims and UnprepareResourceClaims in driver.go are the natural hooks defer-based timing keeps the code clean.
Register REST metrics once:
A blank import of component-base/metrics/prometheus/restclient in kube client setup covers all API traffic from that client.
Expose via Helm. A named container port (metrics), METRICS_PORT env var, and a Service make a future ServiceMonitor straightforward.
What’s Next
This work focused on the kubelet plugin the hot path for DRA on the node. Natural follow-ups:
- Controller and webhook metrics (optional components today)
- A ServiceMonitor template for Prometheus Operator
Conclusion
DRA drivers are becoming first-class infrastructure. They deserve first-class observability. The merged work in PR #232 establishes a pattern, shared metrics package, driver instrumentation, client-go REST metrics, Helm exposure that other drivers can adopt with minimal ceremony.
If you are running GPU or custom device workloads on Kubernetes, scrape *:8080/metrics on your driver DaemonSet and add prepare latency and error-rate panels before your next incident not after.
Contributed upstream to kubernetes-sigs/dra-example-driver via a pull request.